5.3.1 Does your university as a body systematically measure/track women’s application rate, acceptance/entry rate and study completion rate at the university?
Numbers of Students
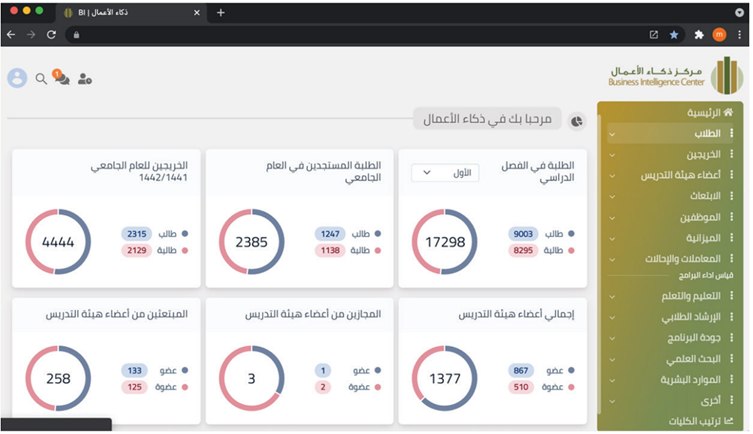
As shown in the above table, the number of male students are 2315 of the total students’ number which is 4444. So, the percentage of the male students is 52% and 48$ refers to the females.
The numbers show that female students are almost half of the university students.
(1/4/1) Total Number of Students (New – Enrolled – Graduates)
Table (1/1/4/1) shows the distribution of new students, enrolled students, and graduates at the university during the academic year 1443/1444 AH, categorized by academic status, nationality, and gender.
Table (1/1/4/1): Distribution of new students, enrolled students, and graduates at the university categorized by academic status, nationality, and gender during the academic year 1443/1444 AH.
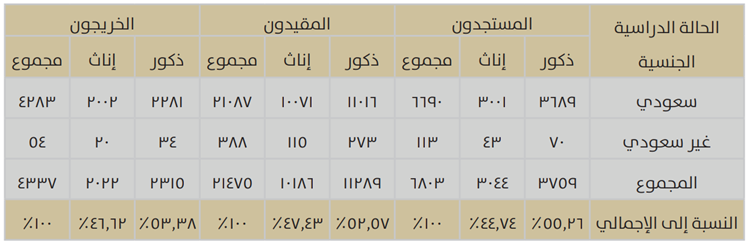
As shown in the above table, the number of graduated Saudi female students is 3001 of the total students’ number which is 6690. So, the percentage of the graduated female students is 45% and 55$ refers to the females.
On the other hand, the overall number of graduated female students is 3044 of the total students’ number which is 6803. So, the percentage of the graduated female students is 45%.
As a result, we notice that the percentage of the graduated female students is almost the half of the overall students’ number.
Figure (2/1/4/1): Percentages of new, enrolled, and graduate students at the university during the academic year 1443/1444 AH.
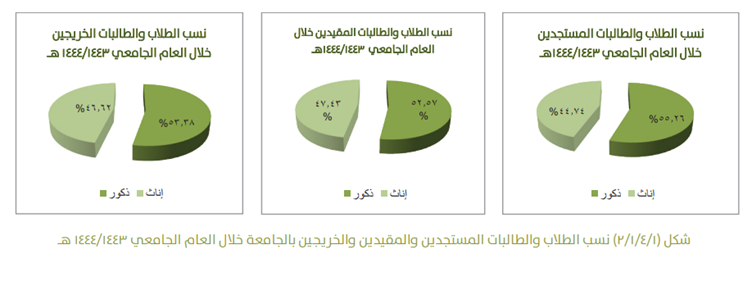
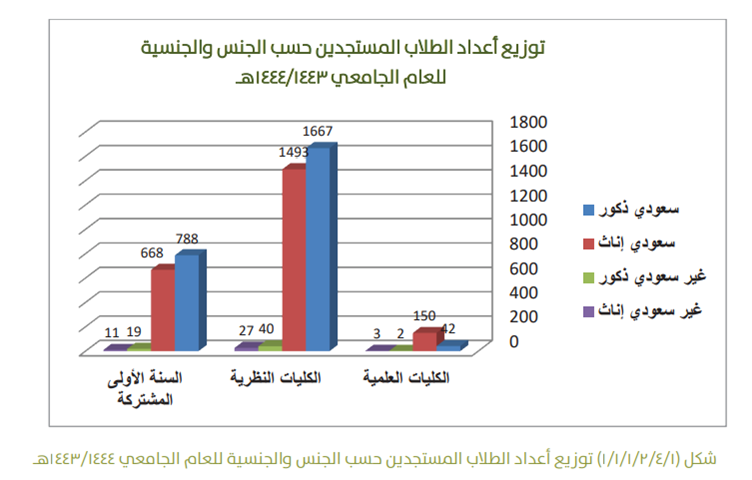
Figure (1/1/2/4/1): Distribution of the number of new students at the university by academic level, nationality, and gender for the academic year 1443/1444 AH.
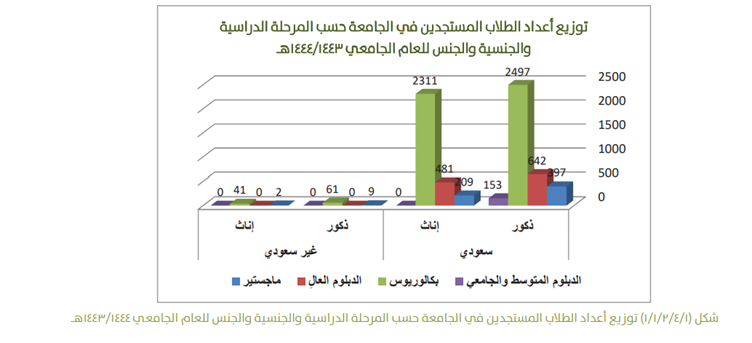
Figure (1/1/1/2/4/1): Distribution of the number of new students by gender and nationality for the academic year 1443/1444 AH.